July 2017
Datorama - Row Usage Optimization
Sudeep Tharien – Lead Consultant

July 2017
Sudeep Tharien – Lead Consultant
Why should I Optimize Rows?
Primarily, the main reason for optimizing row usage is to reduce cost. The number of rows required by you have a big influence on how much you would pay for a Datorama account.
So, if you’d initially decided on an overall row limit of 10 million rows, but then burn through that limit within a few months, you’d have to increase the row limit for that account for an additional price. If storing historical data is of importance, then this limit will have to be raised at regular intervals. By having a second look at the data that needs to be displayed in a Datorama dashboard and including only those fields that are required, you will be able to drastically increase the time before you reach the row limit and significantly decrease platform costs.
A secondary benefit of optimizing row usage is that dashboards and widgets load up faster, making for a smoother end user experience.
Sounds good, but how do I go about it?
There are multiple ways to optimize row usage in Datorama. The easiest way you can optimize rows is to ensure your data streams only contain data for the days that you plan to report on.
However, if you’d like to drastically reduce your row usage, a bit more effort will be required.
Incoming data clean up:
Revisit the reports that are delivered to your Total Connect streams. Focus on the Dimensions instead of the measurements, since increasing or decreasing the number of measurements fields will not change the number of rows. Run through each of the dimensions used and verify that you actually require them. Check the levels of granularity of the dimensions. For e.g. if you’re pulling in City level data, when you only really need Region level data, you can save a bunch of rows by simply changing the granularity in the report to Region level. Ensure that you also modify the data stream mapping so that they don’t reference these fields in future.
For APIs, double check your settings to ensure that you’re not pulling in any extra fields or fields that are at a deeper granularity than required.
Data stream Mapping Cleanup:
It is important to remember that although an uploaded file contains a certain number of rows, Datorama will only count the rows that are stored after data processing. This means that, it is possible to reduce row usage simply by mapping the fields carefully.
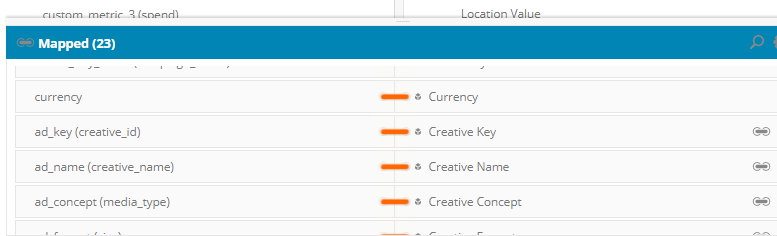
To do this, head over to the mapping section of a data stream and un-map any fields that aren’t required. If data is required only at the campaign level, then it’s a good idea to un-map Media buy and Creative level data. Ensure that you un-map all the fields for a particular entity. For e.g. if you only un-map Creative name and Creative concept, but not the creative key, then your row usage will still remain unchanged.
Changes at the data stream mapping level can also be done for Total Connect streams if the files that they receive cannot be modified. This simple step by itself should significantly reduce row consumption.
Important: If you’re making changes in the data stream mappings, remember that these changes will only apply to data coming in after the changes were made. To optimize historical data as well, remember to manually reprocess the historical data.
Granularity Checks:
In an ideal world, it’d be possible to display all the data available from a data source into a dashboard without any loss in granularity. However due to file size and row restrictions, it becomes necessary to decide how deep we’d like to go while creating a dashboard. Including additional ‘general dimensions’ i.e. Device model, Geo data etc. can cause row usage to shoot up drastically.
However, with some trade-offs, it does become possible to include general dimensions without having to compromise too much on row usage. As an example, assume that your report provides data all the way from the campaign level to the creative level. If you include hourly level data into the same report, the row usage will increase by roughly 23 times the initial value. There are 3 things that can be done at this stage:
Elaborating on Option. ‘c’, If the only purpose of hourly data is to see campaign performance at an hourly level, then creative level data need not be included. In this case, it will be ideal to have 2 separate data streams both using the same report (separate reports – one at the daily, the other at the hourly level for each stream are also fine). One data stream (Daily level) will have all the required fields mapped except for the ‘Hour’ field. The other stream (Hourly level) will have the ‘Hour’ field, campaign level data and measurements mapped. Ensure that you use filtered measurements to differentiate the data between these two streams.
This way, although you won’t be able to view creative level data at an hourly basis, you will still be able to view hourly data at a campaign level with only a minor increase in row usage, without any modifications to the report.
Data Filtering and Grouping:
If there aren’t any fields that can be eliminated or unmapped from a data stream, rows can still be optimized by using by eliminating any excess data from reports or APIs. For e.g. In certain APIs, you may be able to filter for particular advertisers, but not for individual campaigns. Due to this, you may be pulling in data for all campaigns belonging to a certain advertiser, thereby unnecessarily increasing row usage. By using data load rules, it’s possible to pull only those rows that contain required values.
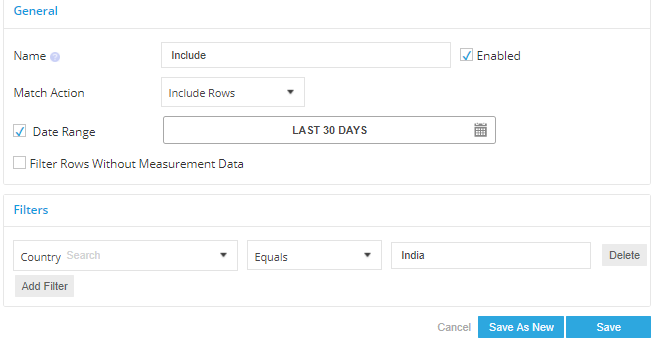
In the below example, a data load rule has been applied to only include those rows that have the country field equaling ‘India’. A similar approach can be followed for Campaign names, Device types, etc. Thus, non-essential data can be prevented from being ingested into the system.
Grouping via Data stream mapping is also possible. Basically, this involves using formulae to group similar entity values together so that they are read as a single entity value. However, for best results the grouping will have to be done all the way down the hierarchy i.e. Campaign, Media Buy, Creative. If done correctly, Datorama will aggregate the values across multiple entity values and thereby reduce the rows depending on the number of grouped entity values.
However, this step is situational and should only be applied if viewing individual entity values isn’t required. Also, due to the complexity and error likelihood, it should be used only if reducing row usage is an extremely important consideration.
High-Impact dashboard. Fast and affordable.
Starts at $1500
 Prev Article


