
Pivot for SQL Data (Using Custom SQL) in Tableau
Are you unable to pivot in Tableau when connected to SQL data? No worries! ...

Qlik Sense - Construction Product Dashboard
Our client wanted a dashboard which they could sell as a Construction Activity product to different...
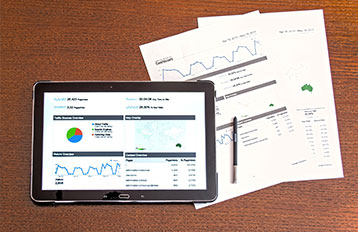
6 Reasons you should move to Google Data Studio
Google Data Studio is a data visualization product of Google. Just like any other Google product, the user interface...

Klipfolio: TV Dashboard to monitor Marketing Campaign Performance
A marketing client required a real-time dashboard that would automatically update data at the back...
Tableau vs QlikView: A Comparison
In the age of democratized business analytics, more and more BI tools are emerging to answer...
Datorama as a Show-stopper in Campaign Analytics
Datorama makes data integration look easy. Its native connections allow you to...

Power BI Premium: A smart move for large enterprise deployments
Data is everywhere in our day-to-day lives. Organizations nowadays, irrespective...

Advance Data Transformation Rules in Datorama
The Sparklore Team came across a project that required a lot of manual...

Datorama - Row Usage Optimization
Primarily, the main reason for optimizing row usage is to reduce cost. The number of rows required by...

Alteryx is an advanced data analytics platform envisioned to serve the needs of business analysts looking...
If you need to publish your dashboard on Tableau Server and view it with selected filters applied to the data, you can...

Is Statistics a boon for Running Effective Business?
In school, we all learn how to take a list of numbers, order them from least to ...
The Right Colors for Visualizing Data
As quoted by Anthony T. Hincks “I celebrate life with a different color...


